If I smile
Do not be swayed
I simply serve the public imageMorrissey, “Disappointed”
Graphics as such cannot be grasped by blind people unless they are described and explained with text. People who are visually impaired (tunnel vision, colour blindness) may not be able to easily perceive the meaning of the graphics.
- Colour contrasts must also be sufficient in the graphics. If they contain elements that help understanding the content, those should be distinguishable in color.
- Avoid too many symbols. If symbols are used, then they should have an explanation in the text. Symbols are never semantically clear and may have a different meaning in different cultures.
- Do not (over)use animations (e.g. Animated Gifs) as they cannot be switched off and may affect people with vertigo or migraines. Or provide mechanisms to stop or skip animations.
- Colours should not conflict with certain cultural meanings. Example: mourning colour in western countries (USA, Europe) is black, in Asian countries (Japan, China) it is white. In Thailand and Brunei, yellow is reserved for kings.
Meaningful alternative Texts for Images
All images should be described in the alt-attribute (= alternative text) regarding their function and content. The images should also be understandable without further context. If no alt-attribute is provided (not even an empty one), screen readers will read the file name aloud, which in most cases is not meaningful at all and confusing.
Alternative texts are also displayed, for example, if the image embedded in the page is not available or loading slowly for some reason (mostly network problems). This also ensures that the information from the image is not lost to all, even sighted users.
Best Practice
- Decorative images: Pictures that are only visually decorative and have no meaning in terms of content should be given an empty alternative text.
- Sensory images: For example pictures of works of art (paintings, photographs etc.). Make sure, you add info about the artist, date and title of the piece of art and add descriptive information to that in its alternative text.
- Functional images:
- If the image is linked, the alternative text should sufficiently describe the linked page, at best containing its page title.
- If the image is used as a button, it should describe the function of the button.
- Images of text: Images that contain text should be avoided (see more below). The text in the image should at least be represented in the alternative text, unless the text is also included on the page with the image. In this case an empty alternative text can be used (duplications should always be avoided).
- Group of images: If a unit of information is to be conveyed via a group of images, then one of the images should contain an alternative text containing this information. The others alternative texts can be left empty.
Example: 5 star rating from 5 star graphics, but only one graphic should contain the actual rating result as information. - Image Map: In HTML this is a graphic map consisting of several sensitive areas that function as links. The map graphic itself should contain an alternative text with a general description of the map, while the clickable areas describe the respective area.
Example: Map of the United States of America with linked federal states. The map has the text “United States of America Map” while the clickable areas contain the name of the federal states. - Complex images (graphs or diagrams): These need at least 2 types of descriptions.
- They should include a short summary description of the image in the alternative text with a note where additional descriptions can be found.
- Additionally, a longer description should be included. This can be on the page or a link to a file (for example another HTML document with the tabular data or an accessible Excel sheet) or a longer descriptive text directly next to the graph.
Example for “Group of Images”
See the Pen Group of Images (Example) by Accessabilly (@accessabilly) on CodePen
Example for “Image Map”
See the Pen Image Map (Example) by Accessabilly (@accessabilly) on CodePen
Alternative Text Decision Tree
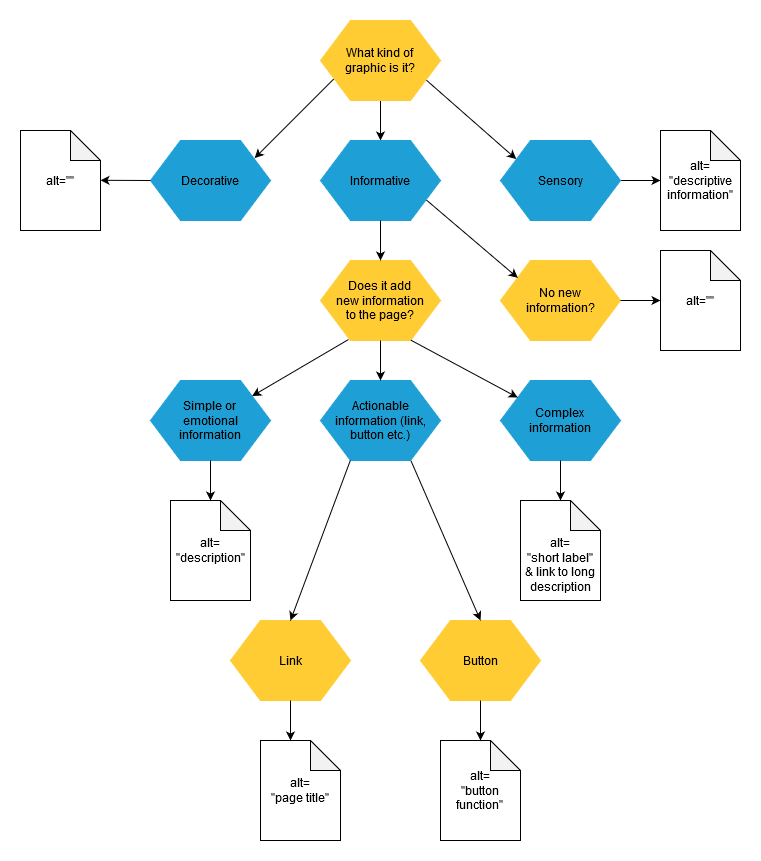
- What kind of graphic is it?
- Is it just decorative? Example: header graphic with flowers
alt=""
- Is it sensory? Example: a work of art.
alt="descrption"
- Is it informative?
- It doesn’t add new info to the page, that isn’t represented in the text content already:
alt=""
- It adds new info to the page
- Actionable information (link, button or input)
- Link:
alt="page title"oralt="label for link" - Button or input:
alt="function of the button or input"
- Link:
- Simple, emotional information
alt="description"
- Long or Complex Information
alt="short label"& link to additional information
- Actionable information (link, button or input)
- It doesn’t add new info to the page, that isn’t represented in the text content already:
- Is it just decorative? Example: header graphic with flowers
Inspired by Deque’s “Top 5 Questions Asked in Accessibility Trainings” and 4 Syllables’ “Text alternatives – a decision tree“
Bad Practice
- Wordings such as “picture of …” should be omitted. Screen readers always read graphics as “graphics” at the beginning.
- Keyword Stuffing: This was an old SEO (Search Engine Optimization) “technique” that aimed to “hide” as many relevant keywords as possible in alt attributes of images. However, this technique is regarded as an abuse by search engines and not suitable for blind people at all. Meanwhile search engines also prefer organic texts and so one is punished with such practices. Always keep in mind: alt-attributes are for people who have no visual access to the image!
- Images containing text should be avoided, because they cannot be scaled freely without the text becoming illegible. It is better to explain these contents as pure text. Logos with text content are however allowed.
Data Visualization (Diagrams, Graphs)
- Diagrams should facilitate the perception of data and their interrelationships. They are a form of user interface for data!
- At least a short summary of the diagram should be included in the alternative text of the diagram.
- Infographics always need a text alternative that is directly connected to the graph (table or list, depending on the semantics). This information does not have to be on the same page, but an anchor link that refers to the text alternative should be inserted before the infographics. A text alternative can also be an accessible Excel or PDF or similar file for downloading.
- Colors should not be the only distinguishing feature for curve, bar or pie charts. You should also work with different hatching, fill patterns, shapes or textures. This ensures that your diagram still works in a printed version or on a lower contrast projector.
- At best the graphic is implemented as SVG (Scalable Vector Graphic). This basically consists of semantic markup.
- Individual elements such as the X and Y axis of a coordinate system and points or curves or diagrams in it can be enriched with explanatory texts and are thus also machine-readable.
- They can also be extended with special attributes so that they can be navigated with the keyboard (keyboard operability).
Tools
- One promising tool for accessible graphs is Highcharts. Check the accessibility demos here and make sure, you work with their Accessibility Module.
- Another nice tool for accessible diagrams an graphs is Fizz. It’s still in alpha version while writing this.